Vehicle Detection
By Grant Pearse
A first effort at large-scale AI deployment - detecting vehicles across New Zealand without collecting local training data.
Quick links
Background
There are over 4.4 million vehicles in New Zealand according to government registration data. For the most part, they are quite easy to pick out on high-resolution aerial imagery and there are plenty of them in nearly every urban scene. Because they are such a good target for detection, there are quite a few academic datasets where vehicles of some type have been labelled in aerial imagery. This presented an opportunity to piece together a big dataset and train some of the newer deep learning object detection models. The goal was to see how well they would work when applied to imagery across NZ and find out how many of those 4.4 million cars could be detected.
The Datasets
After a lot of searching and checking I selected the following datasets:
-
VEDAI (2014)
Links: Paper and Data.
Notes: Land vehicles plus boats & planes. -
VAID (2020) Links: Paper and Data
Notes: Low altitude, sequences from fixed POVs in Taiwan. -
UCAS-AOD (2020) Links: Data Github
Notes: High-resolution Google Earth imagery with oriented bounding boxes. -
ITCVD (2018) Links: Data. Paper
Notes: Nadir (unrectified) and oblique. Large, high-resolution images. -
COWC (2016) Links: Data. Paper
Notes: Dataset of vehicle point locations. Bounding boxes are approximate. Big scenes. Columbus and Vaihingen are in greyscale. Includes data from Selwyn, NZ -
DOTA-v2 (2021) Links: Data. Paper
Notes: Huge dataset with many classes (incl. small / large vehicle) and imagery sources, sizes and resolutions. Superset of iSAID / DOTA-v1. -
DLR-MVDA aka DLR Munich 3K (2015) Links: Data
Notes: Oriented bounding boxes sometimes extend beyond objects. Some harder scenes. -
FAIR1M (2021) Links: Data. Paper or on arXiv
Notes: Largest dataset at time of publication. Mixed sources (GF sat, and Google aerials) and some very big scenes. Part of ISPRS benchmark challenge.
There were also a few that looked promising but didn’t make the cut
- CASD - Data from Christchurch. Perfect fit but corrupt SHP online. Timely reminder
- SIMD - Labels incomplete on many scenes.
- KIT-AIS - Better suited to object tracking etc.
- NWPU-VHR-10 - Medium resolution satellite data only.
- HRRSD - Lower resolution/quality imagery than typical NZ aerials.
Only one of these datasets - COWC - had any data from New Zealand. This was a handful of aerial scenes from Selwyn, NZ a few years back. The full dataset had ~127 000 vehicles across 4700 images.
Results
Benchmarking highlighted the Yolo family of object detectors as being both accurate and fast for this task. Scaled-Yolov4 did particularly well on small vehicles. I used AlexeyAB’s Darknet implementation. The model finished with an average precision (AP@IoU=.50) of 0.75 on the validation set which is pretty good but leaves room for improvement. Pooling several datasets together created inconsistencies like the COWC bounding boxes being approximate leaving lots of margin or clipping objects. Some datasets included trailers as part of the vehicle label while others didn’t etc. Fixing these would improve the model further.
I ran the final model on all areas in New Zealand where the basemap imagery resolution was better than 15cm. Anything coarser than this triggered too many mistakes.
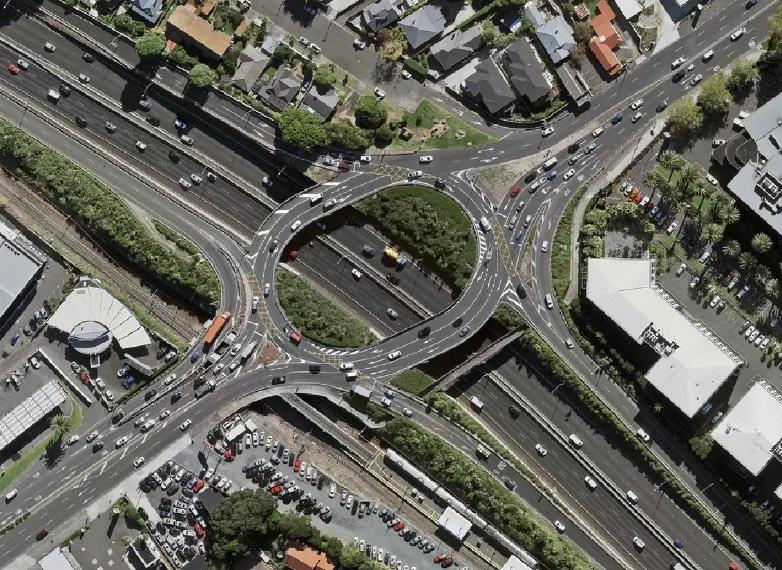
Visual Assessment
The model generally did very well detecting vehicles in the New Zealand imagery. This was impressive given the lack of local training data. You can view the predictions on the main webmap site. Expired predictions are highlighted there as well.
Some observations after spending far too long looking at the predictions across NZ:
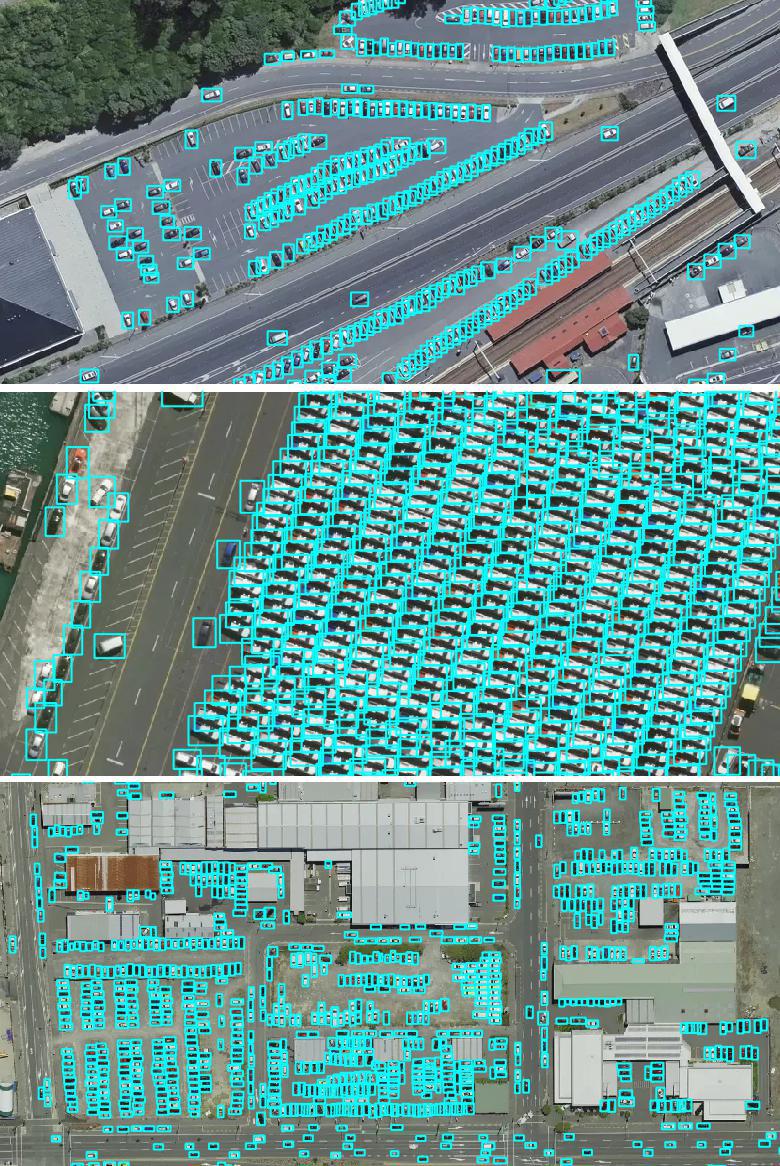
- The accuracy was surprisingly good in some difficult areas.
- The better the imagery the better the results.
- Vehicles in shadow are often detected. A first prototype of the model failed badly at this but simulating shadows using Albumentations during training looks to have helped a lot.
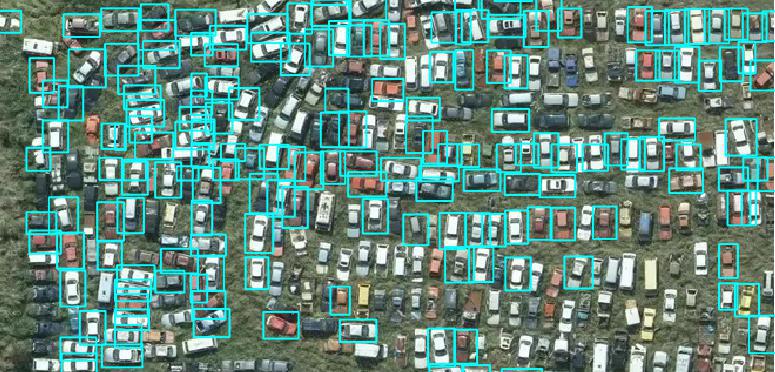
- It also handled dense scenes like parking lots quite well after modifying the model settings to handle this and fine-tuning the non-maximum suppression routines. These changes did introduce occasional duplicate detections in dense scenes though.
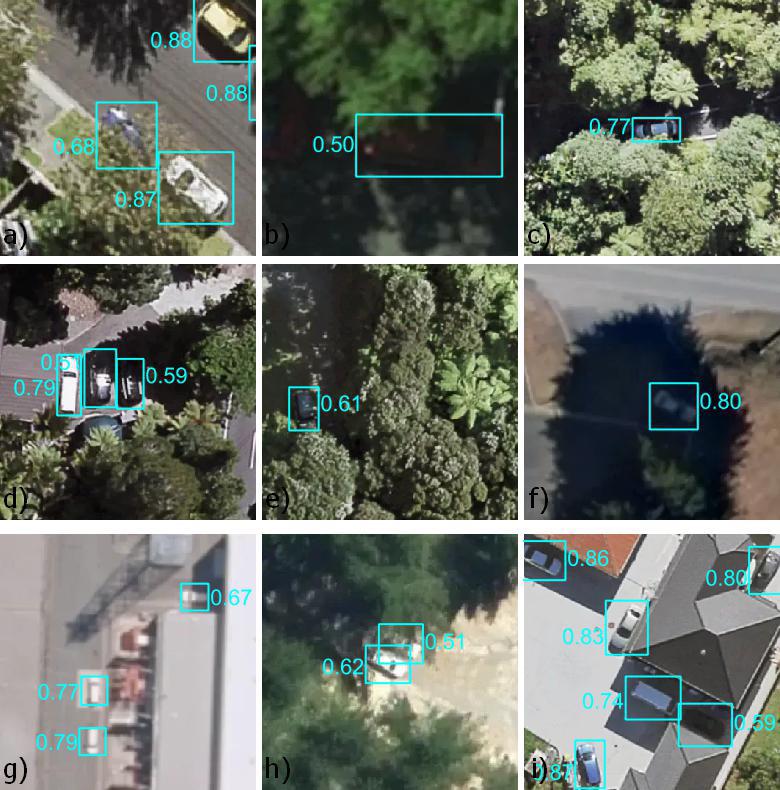
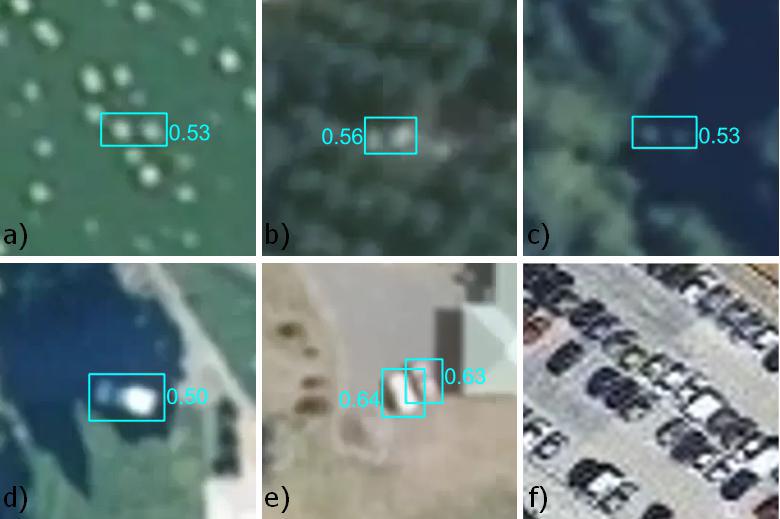
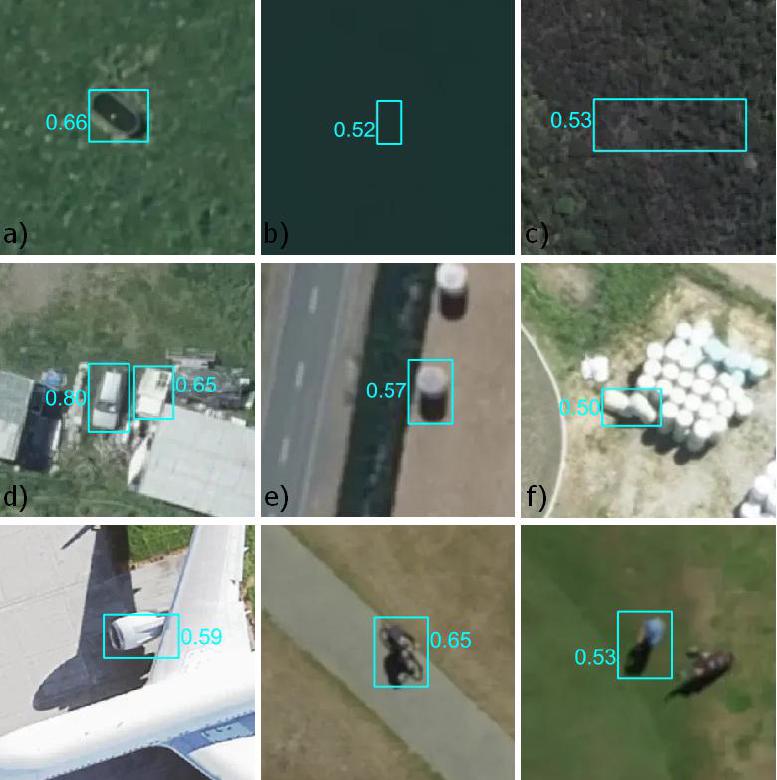
False Positives
There was a persistent issue with false positive detections triggered by water, native bush and other background scenes. Looking more closely, these often had a common property - white rectangles with a darker band where a windscreen might be (a - c below) which is about as much detail as you get from actual vehicles in low resolution imagery (d - e below). The most likely cause is that some low-resolution training data like (f) below should have been excluded to prevent the model learning such a generic representation for ‘vehicle’. These were especially common in the upsampled low-resolution imagery.
Some of the false positives were less understandable though.
The confidence scores for the confusing objects were generally low so these issues should be easy to fix by adding these examples into the dataset as ‘hard negatives’. I did include negative background samples during training, but all of these images came from the urban/peri-urban source datasets and it looks like some background patches of water and New Zealand bush are needed.
False Negatives
Missed detections often came from rare vehicle classes like heavy machinery and earth moving equipment (a - b below), large or specialised trucks, tractors and agricultural machinery (c - g). Sometimes these were detected in one pose but missed in another (b,c e, & f below). One solution would be to multiply up these examples with extra augmentations like rotation and CutMix.
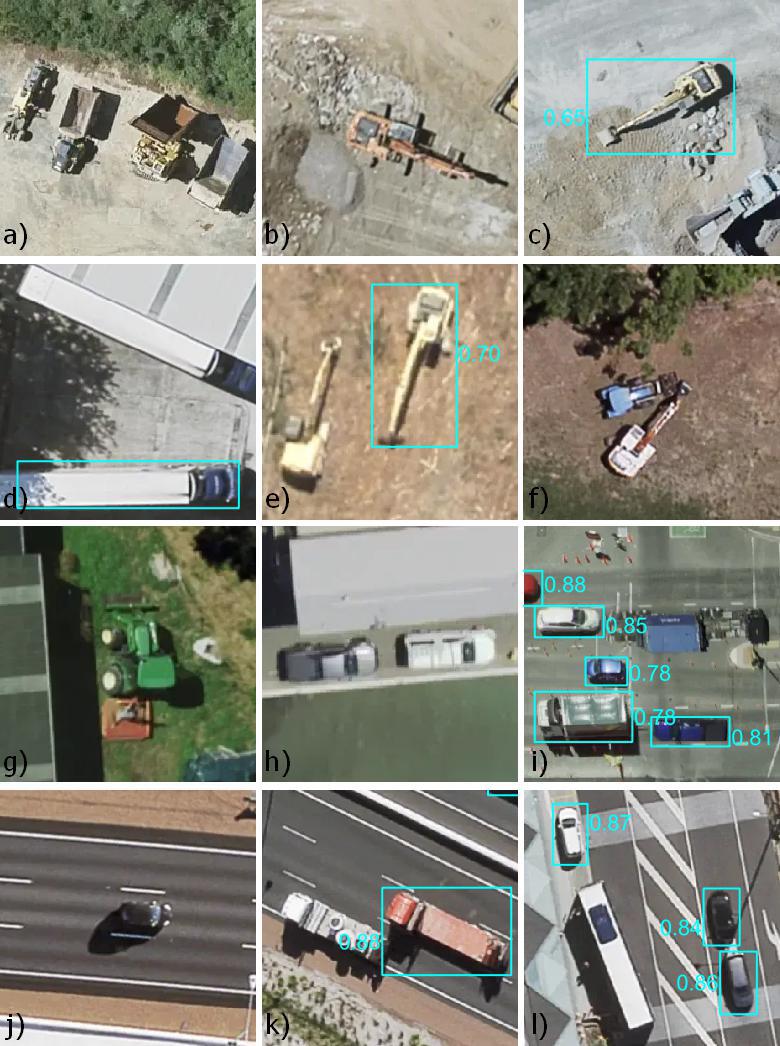
These were all uncommon in the source datasets, but they also tended to look different to New Zealand equivalents - for example the DOTA datasets includes parking lots full of the classic yellow school buses from the USA rather than examples like (l above). The model was surprisingly sensitive to changes in perspective seen in poorly rectified imagery (g - i above).
Conclusion
So how many of those 4.4 million vehicles could be identified in the imagery? The total number of predictions with confidence >= 50% came to ~2.2 million. So plenty of vehicles still to be detected. Maybe they are under cover or in areas without high-resolution imagery or maybe they have weathered away in a field until the model can no longer recognise them.
Future work
I was impressed with the overall accuracy of the model. At least for this task, a model trained on overseas data generalised well when applied to New Zealand imagery. It does make me curious to know how much better the results would be with local data. If I revisit this model I would consider:
- Filtering out more of the low-res imagery from the source datasets.
- Adding the huge DLR dataset pending its publication - this is so big I could probably drop some of the other datasets.
- Find and add false positives/negatives from NZ including the rarer classes.
- Add in ‘hard negative’ background chips from water / vegetation and rural scenes.
- Update benchmarking and move to a SOTA model.
Image Credits
Unless otherwise stated, all New Zealand imagery sourced from the LINZ Data Service and licensed for reuse under the CC BY 4.0 licence.